Quickstart
Install
pip install jsonantt
jsonantt requires Python 3.8+ and depends only on matplotlib.
Your first chart
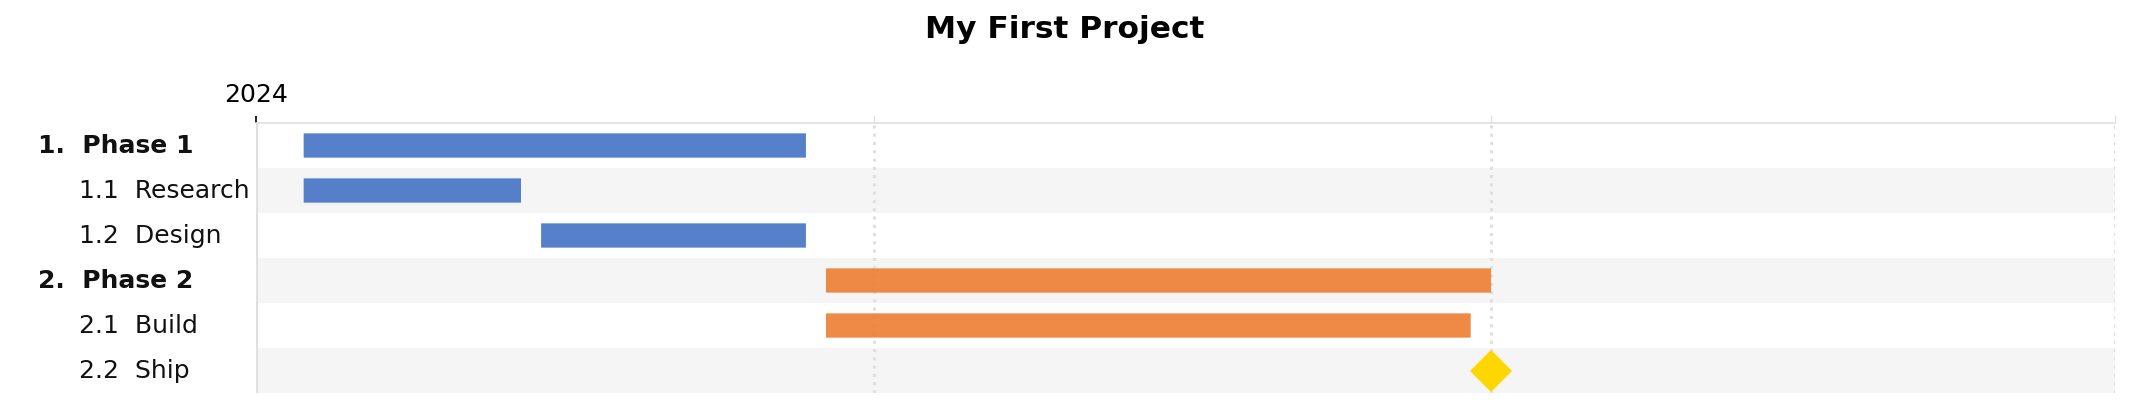
Create a file called project.json:
{
  "title": "My First Project",
  "dateformat": "%Y-%m-%d",
  "tasks": [
    {
      "name": "Phase 1",
      "children": [
        { "name": "Research",  "start": "2024-01-08", "end": "2024-02-09" },
        { "name": "Design",    "start": "2024-02-12", "end": "2024-03-22" }
      ]
    },
    {
      "name": "Phase 2",
      "children": [
        { "name": "Build",     "start": "2024-03-25", "end": "2024-06-28" },
        { "name": "Ship",      "milestone": true, "date": "2024-07-01", "color": "#FFD700" }
      ]
    }
  ]
}
Then run:
jsonantt project.json chart.png
Open chart.png — you have a Gantt chart.
Adding tick marks and style
Wrap your tasks with a style block to control fonts, gridlines, and tick marks:
{
  "title": "My First Project",
  "dateformat": "%Y-%m-%d",
  "style": {
    "major_tick": "year",
    "minor_tick": "quarter",
    "tick_position": "top",
    "font_size": 11
  },
  "tasks": [ "..." ]
}
See Style Guide for every available style field.
Using durations instead of end dates
Instead of a hard end date, specify a duration:
{ "name": "Sprint 1", "start": "2024-01-08", "duration": "2w" }
Duration units:
Suffix |
Meaning |
|---|---|
|
Calendar days |
|
Weeks (7 days each) |
|
Calendar months |
|
Calendar years |
Chaining tasks with not_before
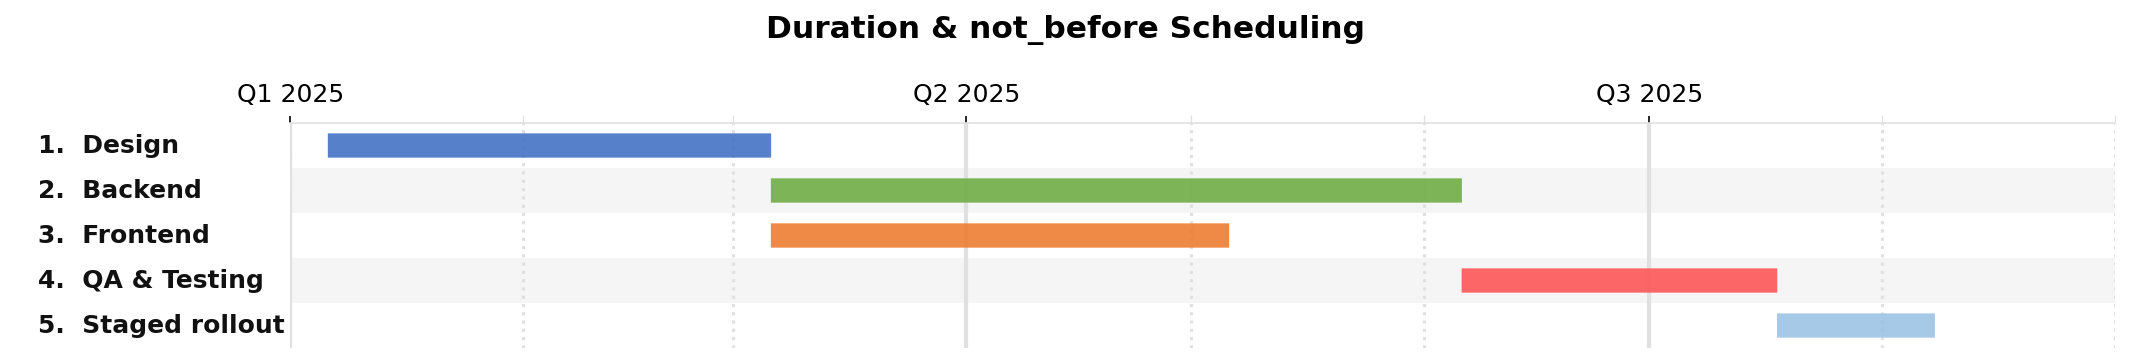
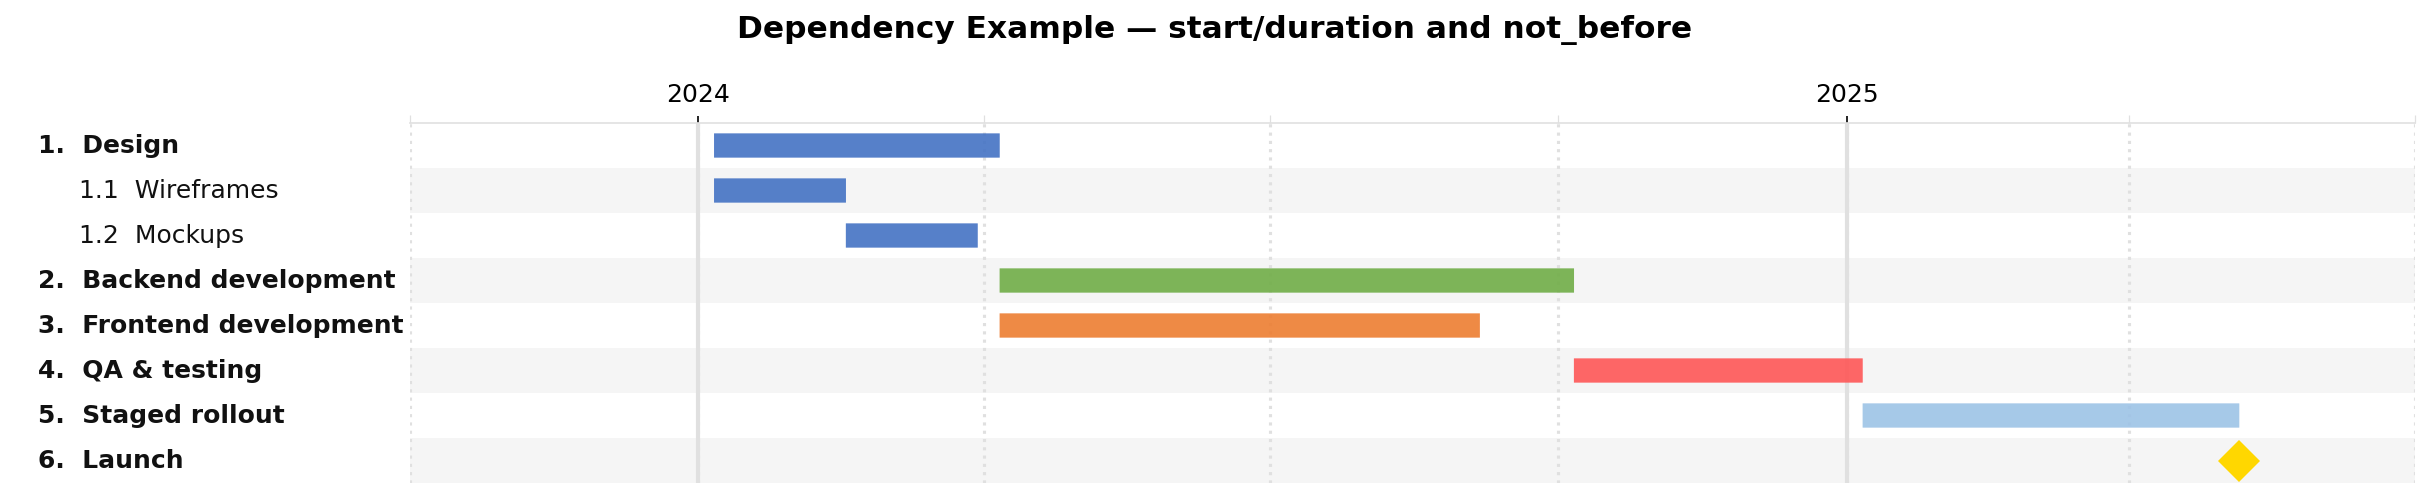
Give tasks an id and use not_before to automatically start a task after another ends:
{
  "tasks": [
    { "id": "design",  "name": "Design",      "start": "2024-01-06", "duration": "3m" },
    { "id": "backend", "name": "Backend",      "not_before": "design", "duration": "6m" },
    { "id": "qa",      "name": "QA & Testing", "not_before": "backend", "duration": "2m" }
  ]
}
not_before also works with parent-task IDs — it will start after the latest child end.
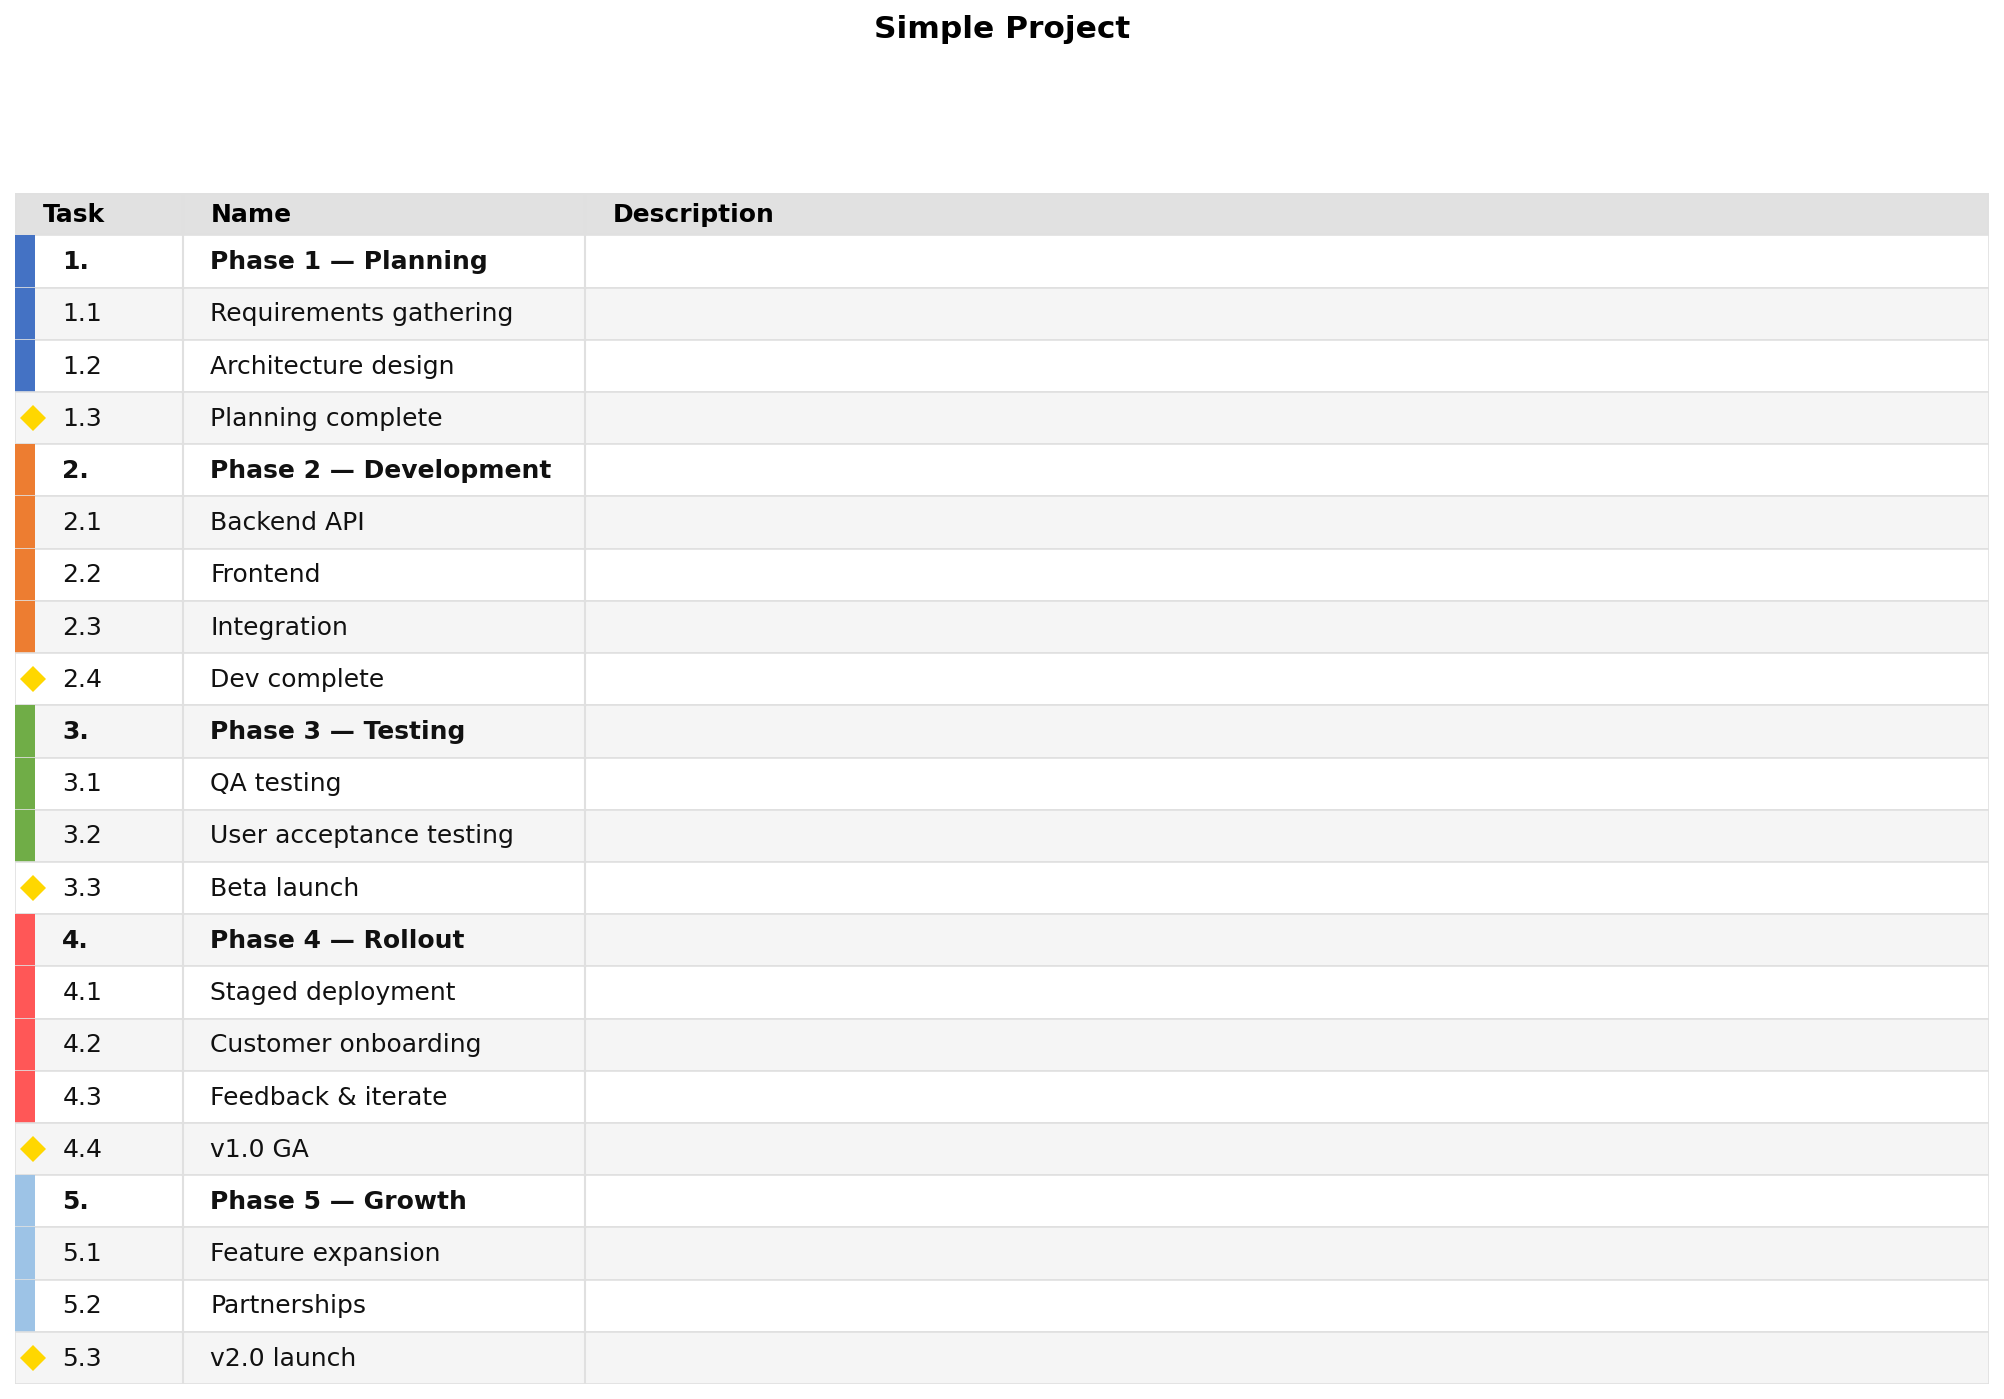
Render a task table
jsonantt -t project.json table.png
Add --milestones-only to show only milestone rows, or --no-milestones to hide them.
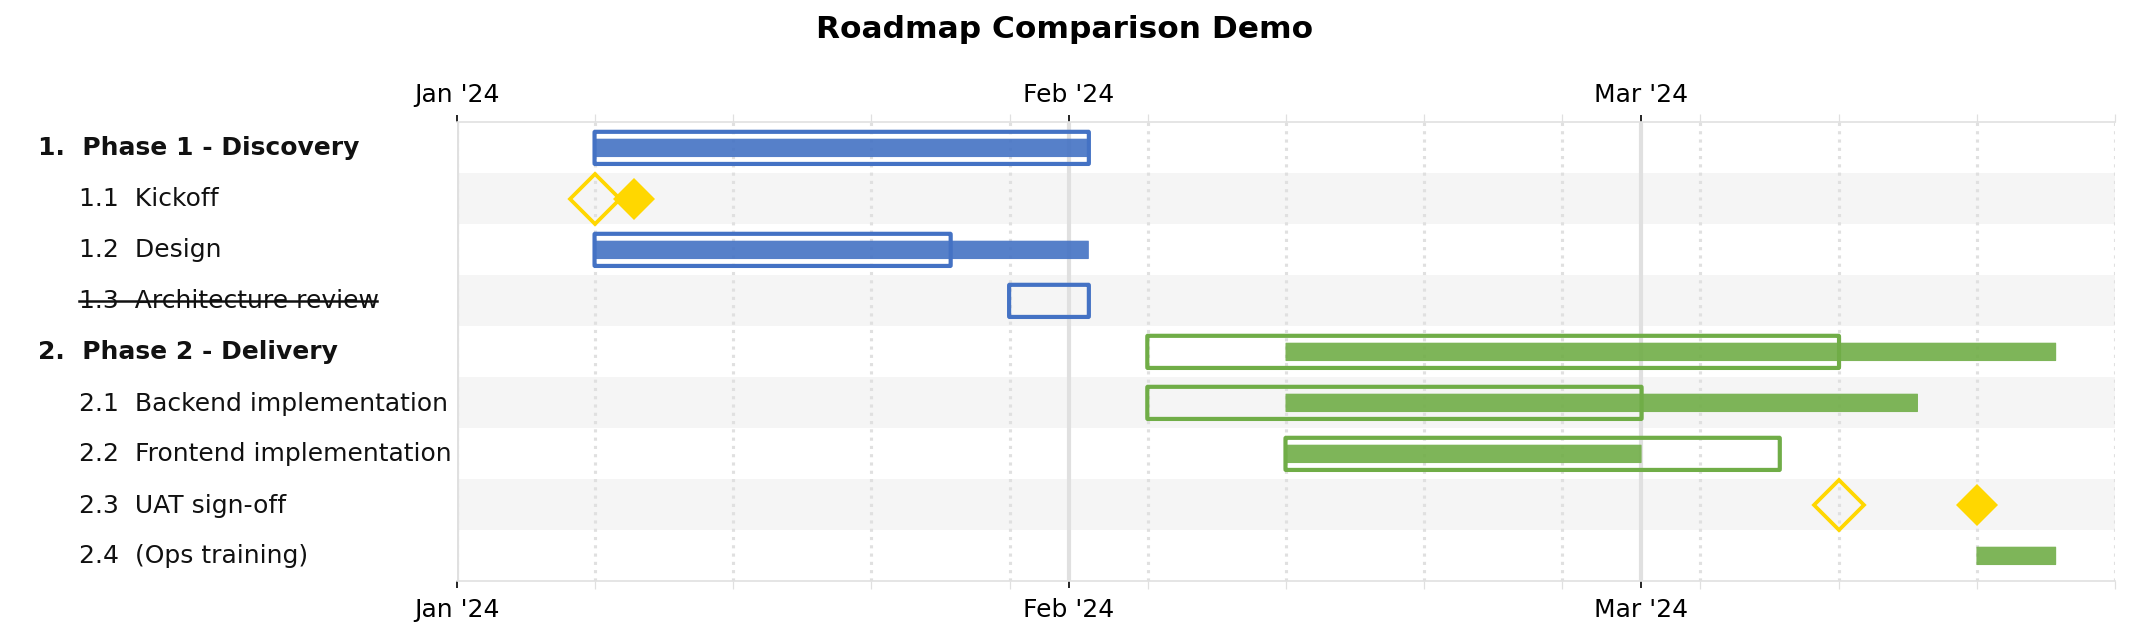
Compare two schedules
jsonantt planned.json compare.png --compare actual.json
The planned.json baseline is shown in full opacity; actual.json deviations appear alongside it.
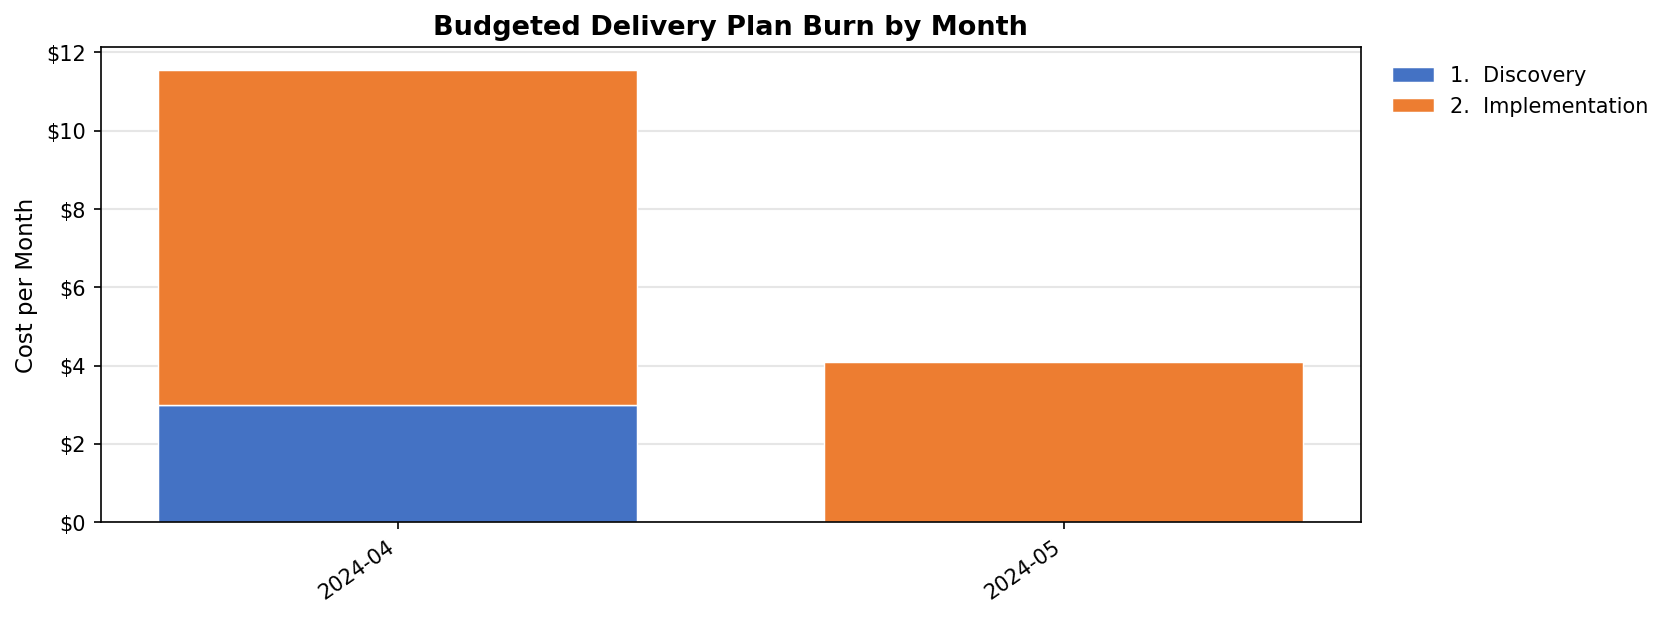
Burn chart
If tasks carry a numeric field (e.g. "cost": 50000), generate a funded burn-down chart:
jsonantt project.json burn.png --burn --burn-field cost --burn-period month --burn-group 0
Next steps
Every field you can put in a JSON file, with a full skeleton example |
|
Every |
|
Full command-line reference with a quick-reference table |
|
Annotated walkthroughs of the three bundled examples plus common recipes |