Examples
The examples/ directory in the repository contains three ready-to-run examples,
and docs/examples/ contains the smaller fixtures used in this manual.
Each is self-contained — copy, edit, and run with jsonantt.
jsonantt examples/simple.json       /tmp/simple.png
jsonantt examples/complex.json      /tmp/complex.png
jsonantt examples/dependencies.json /tmp/deps.png
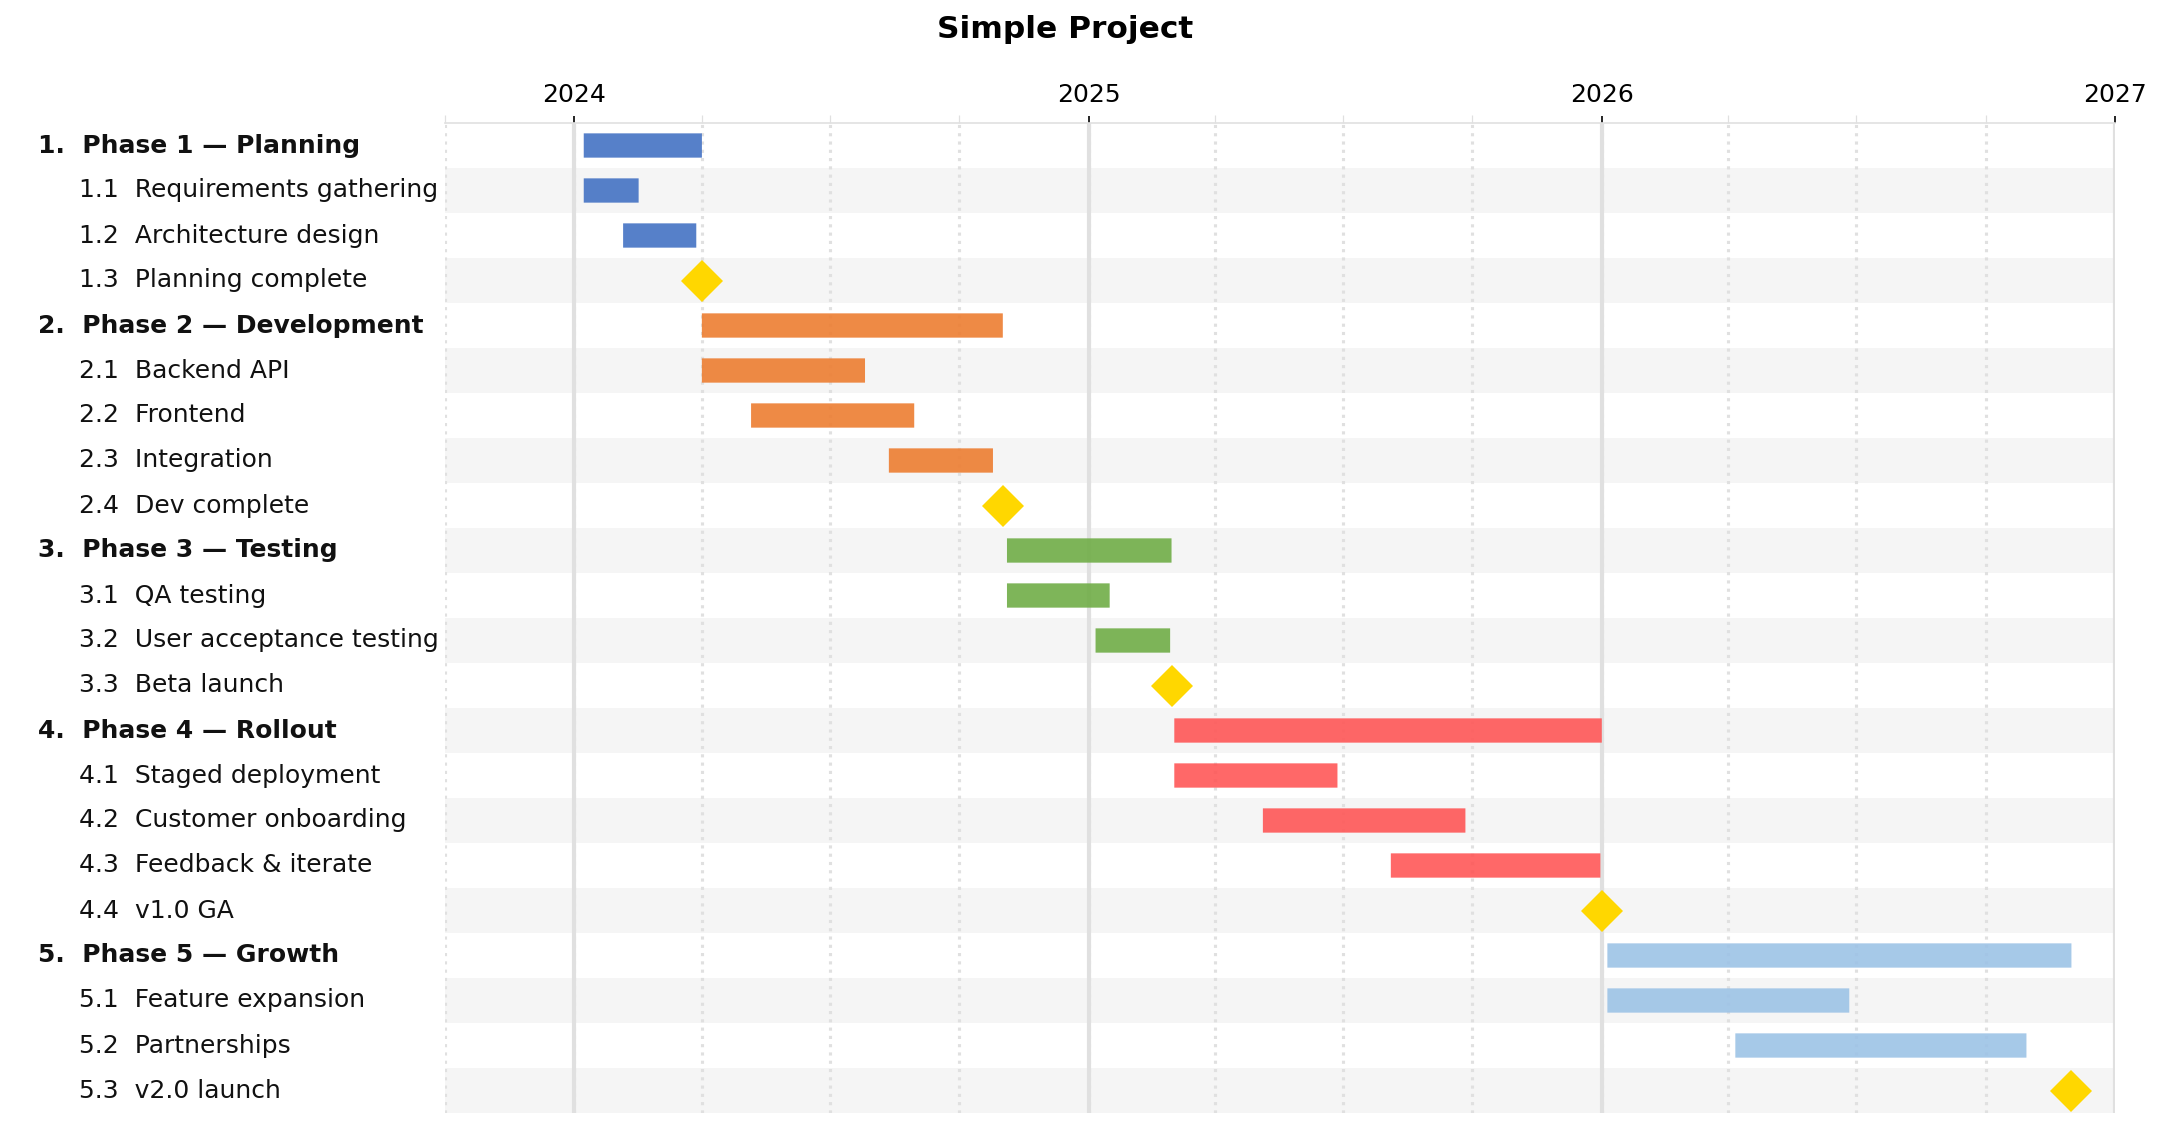
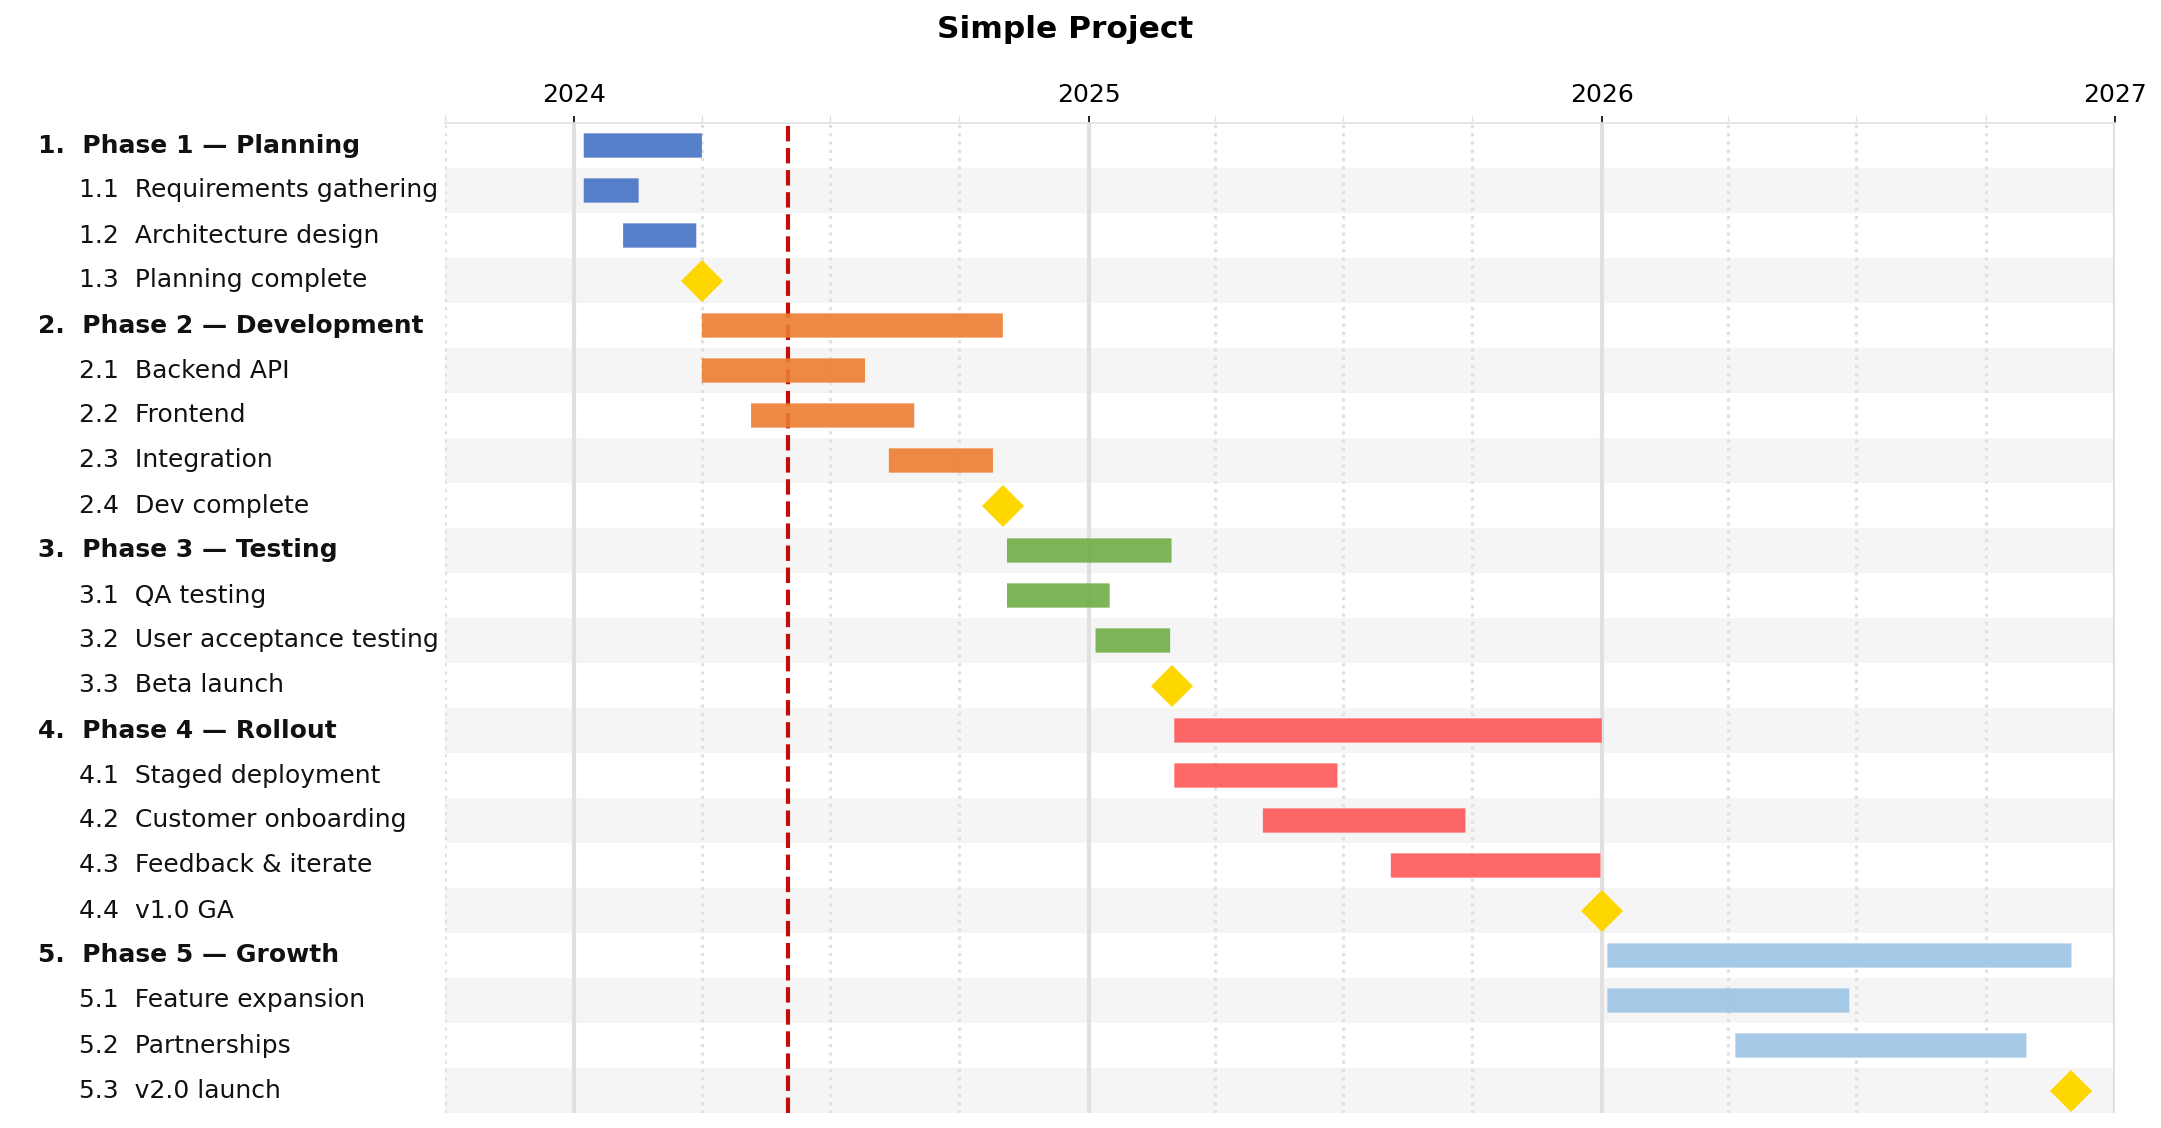
simple.json — three-year project plan
What it shows: a clean multi-phase project with nested milestones, year/quarter ticks, and the default color palette.
Key fields used
Field |
Role in this example |
|---|---|
|
Chart heading |
|
|
|
|
|
|
|
Phase tasks have no dates; span derives from children |
|
Leaf tasks use explicit date ranges |
|
|
|
The exact date the milestone falls on |
|
|
JSON
{
  "title": "Simple Project",
  "dateformat": "%Y-%m-%d",
  "style": {
    "major_tick": "year",
    "minor_tick": "quarter"
  },
  "tasks": [
    {
      "name": "Phase 1 — Planning",
      "children": [
        { "name": "Requirements gathering", "start": "2024-01-08", "end": "2024-02-16" },
        { "name": "Architecture design",    "start": "2024-02-05", "end": "2024-03-28" },
        { "name": "Planning complete", "milestone": true, "date": "2024-04-01",
          "color": "#FFD700" }
      ]
    },
    {
      "name": "Phase 2 — Development",
      "children": [
        { "name": "Backend API",  "start": "2024-04-01", "end": "2024-07-26" },
        { "name": "Frontend",     "start": "2024-05-06", "end": "2024-08-30" },
        { "name": "Integration",  "start": "2024-08-12", "end": "2024-10-25" },
        { "name": "Dev complete", "milestone": true, "date": "2024-11-01",
          "color": "#FFD700" }
      ]
    }
  ]
}
Output
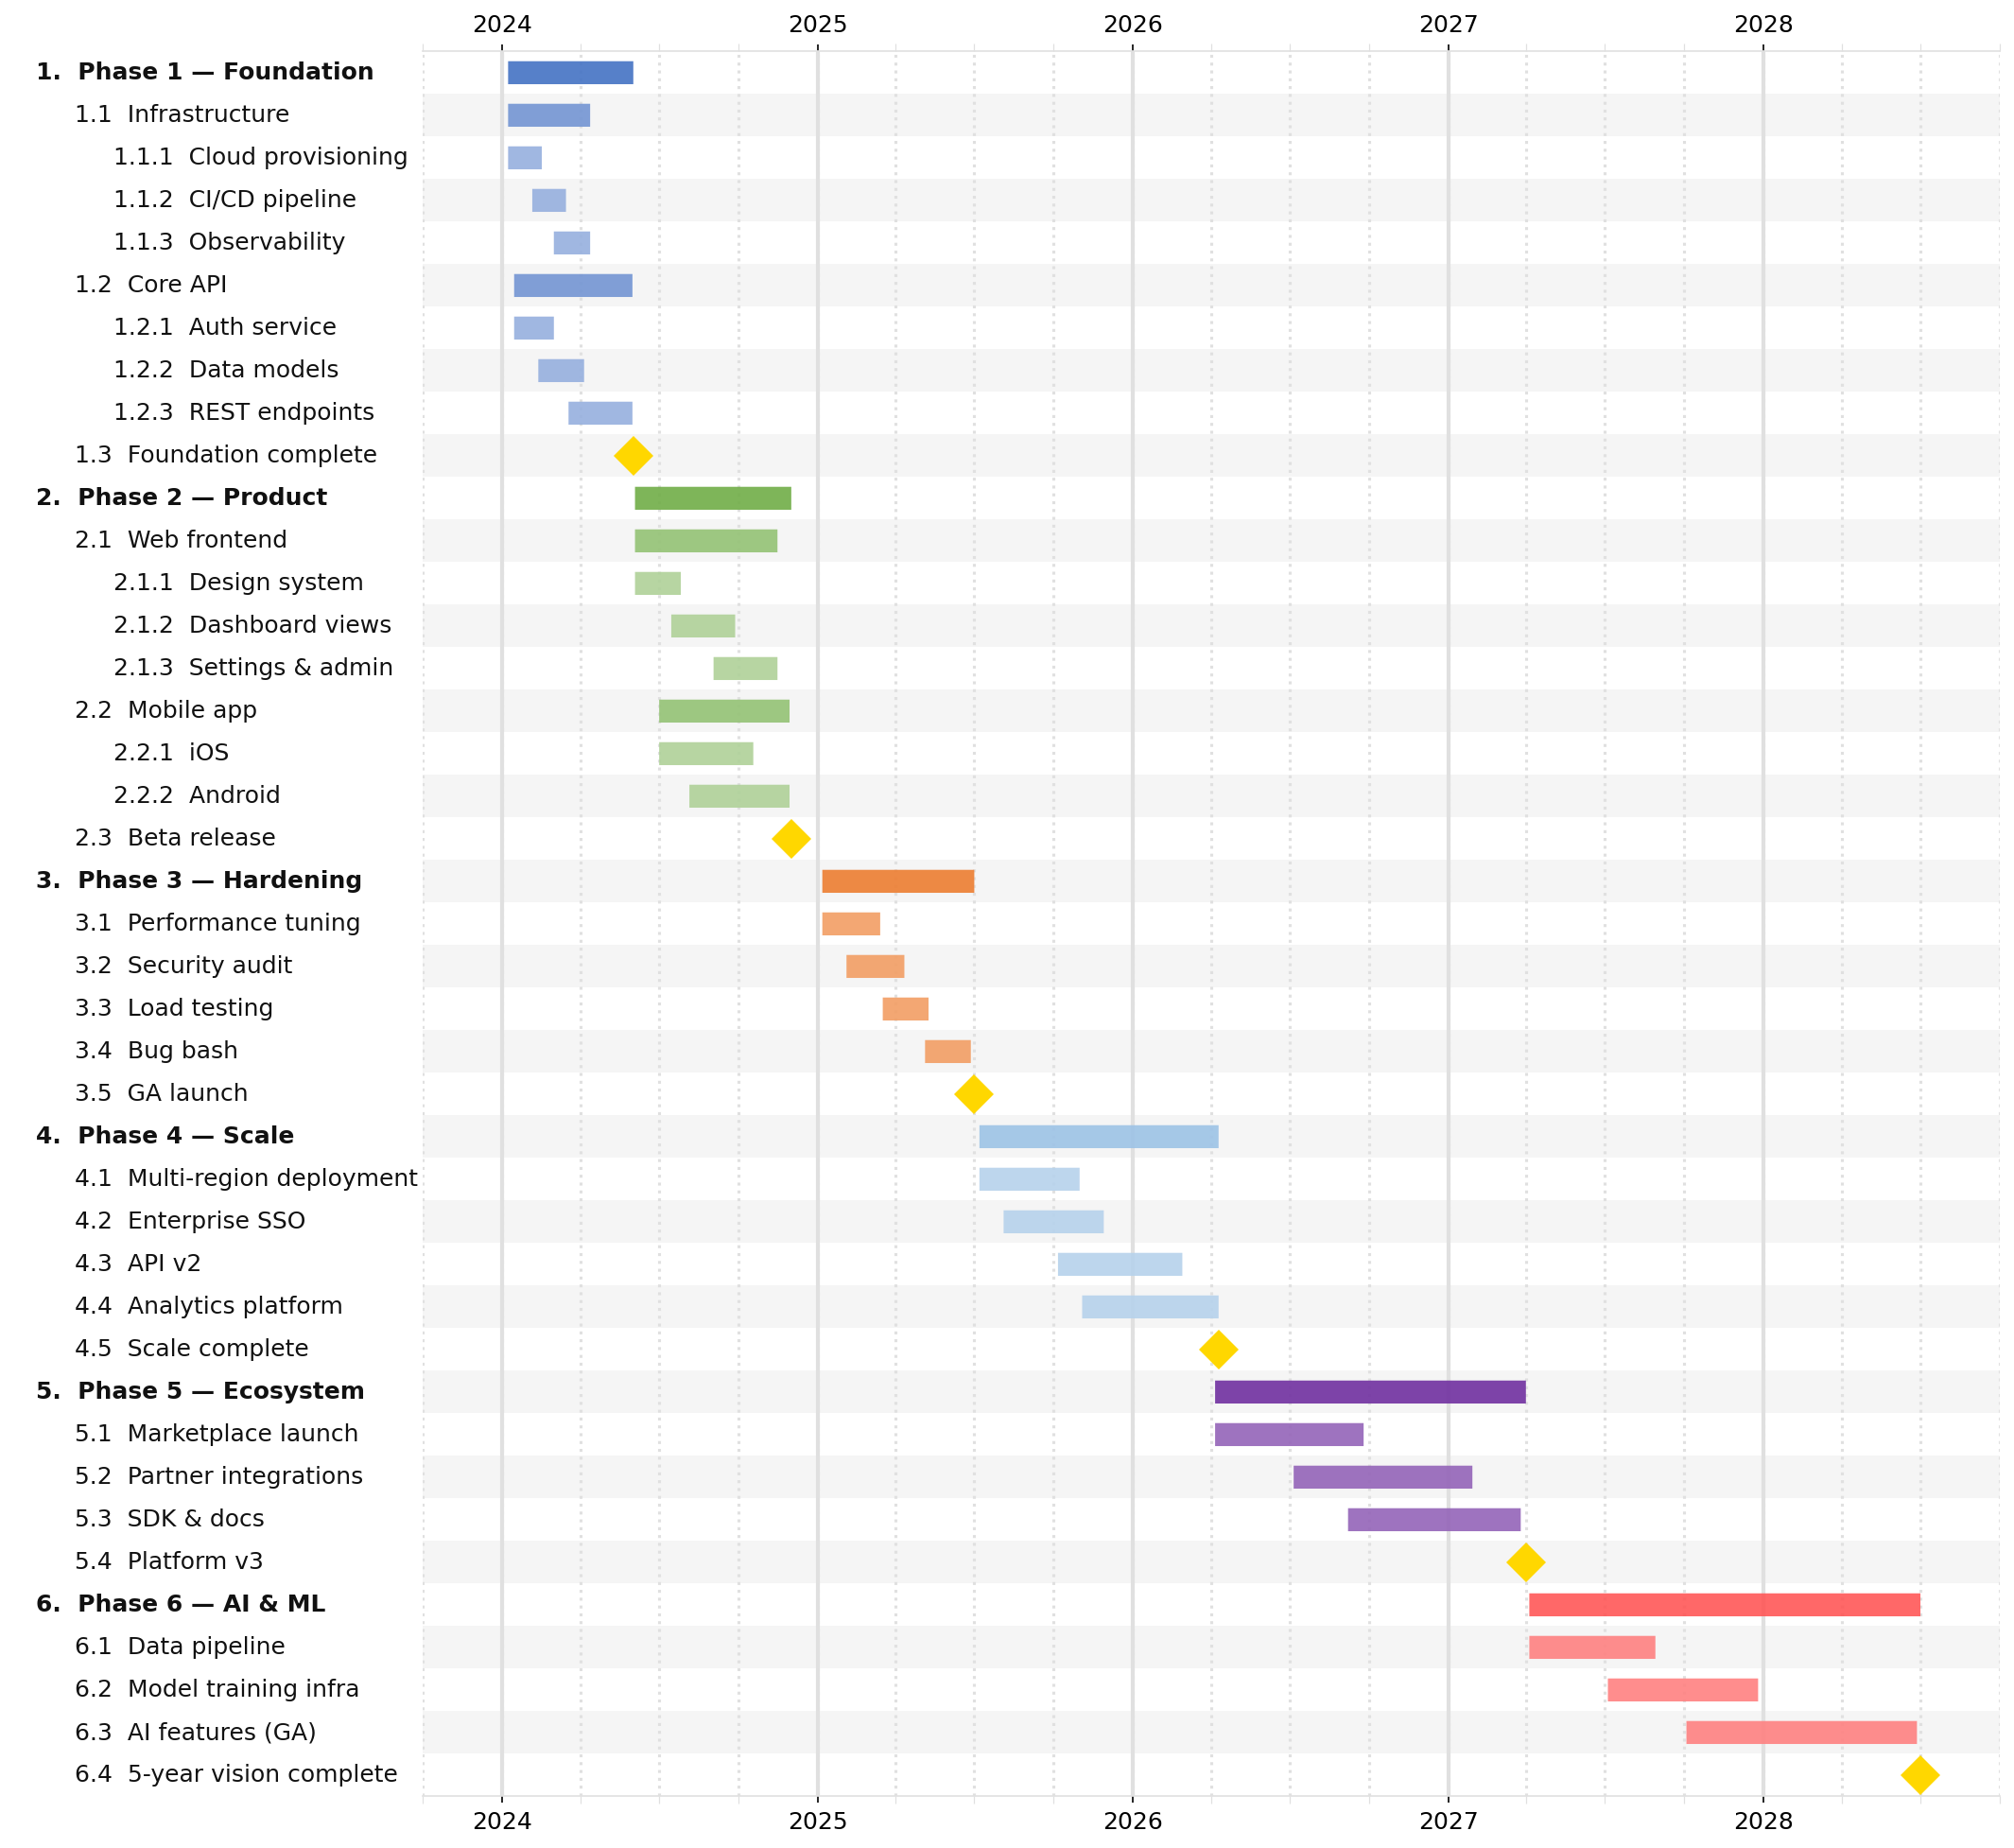
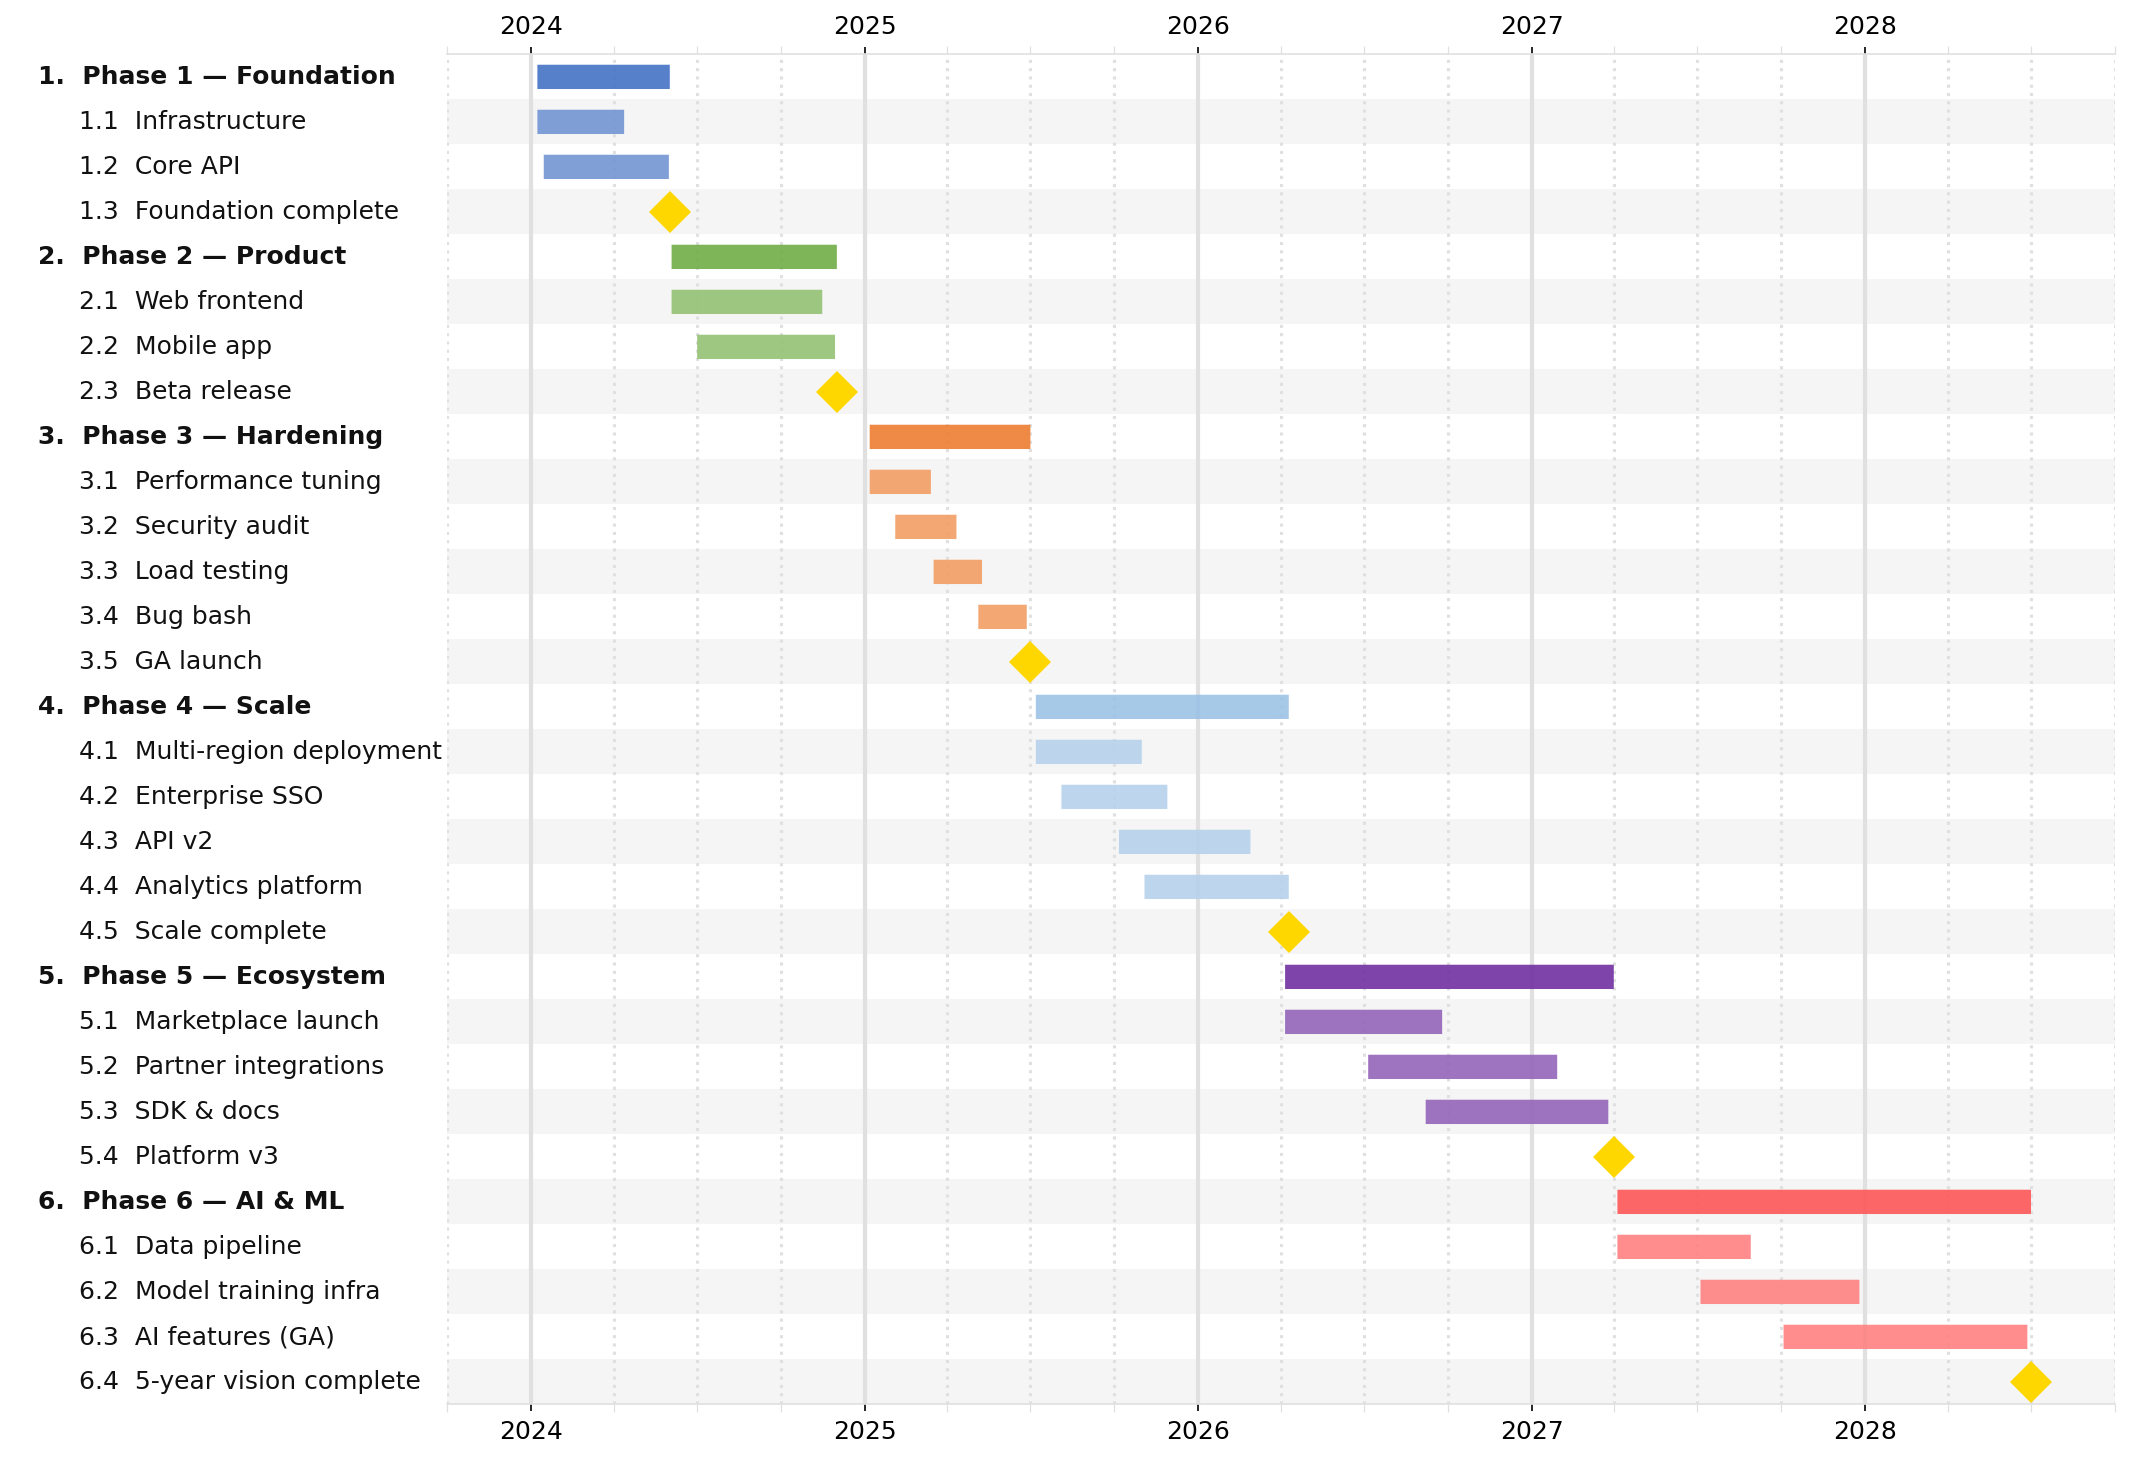
complex.json — five-year engineering roadmap
What it shows: three levels of nesting, subtask_lightening_pct for color inheritance,
tick_position: "both" to label ticks on both axes, and no title for a tighter layout.
Key fields used
Field |
Role in this example |
|---|---|
|
Removing the title eliminates dead whitespace at the top |
|
|
|
|
|
|
|
|
|
|
|
|
|
Set on each top-level phase; children inherit and auto-lighten |
|
Stored on each task; available in table output via |
Three nesting levels |
Phase → Group → Leaf; summary bars auto-span all descendants |
JSON (abbreviated — see examples/complex.json for the full file)
{
  "dateformat": "%Y-%m-%d",
  "style": {
    "row_height": 0.3,
    "font_size": 12,
    "indent_size": 3,
    "subtask_lightening_pct": 25,
    "major_tick": "year",
    "minor_tick": "quarter",
    "tick_position": "both"
  },
  "tasks": [
    {
      "name": "Phase 1 — Foundation",
      "color": "#4472C4",
      "children": [
        {
          "name": "Infrastructure",
          "children": [
            { "name": "Cloud provisioning", "start": "2024-01-08", "end": "2024-02-16" },
            { "name": "CI/CD pipeline",     "start": "2024-02-05", "end": "2024-03-15" }
          ]
        },
        {
          "name": "Foundation complete",
          "milestone": true, "date": "2024-06-01", "color": "#FFD700"
        }
      ]
    }
  ]
}
Output
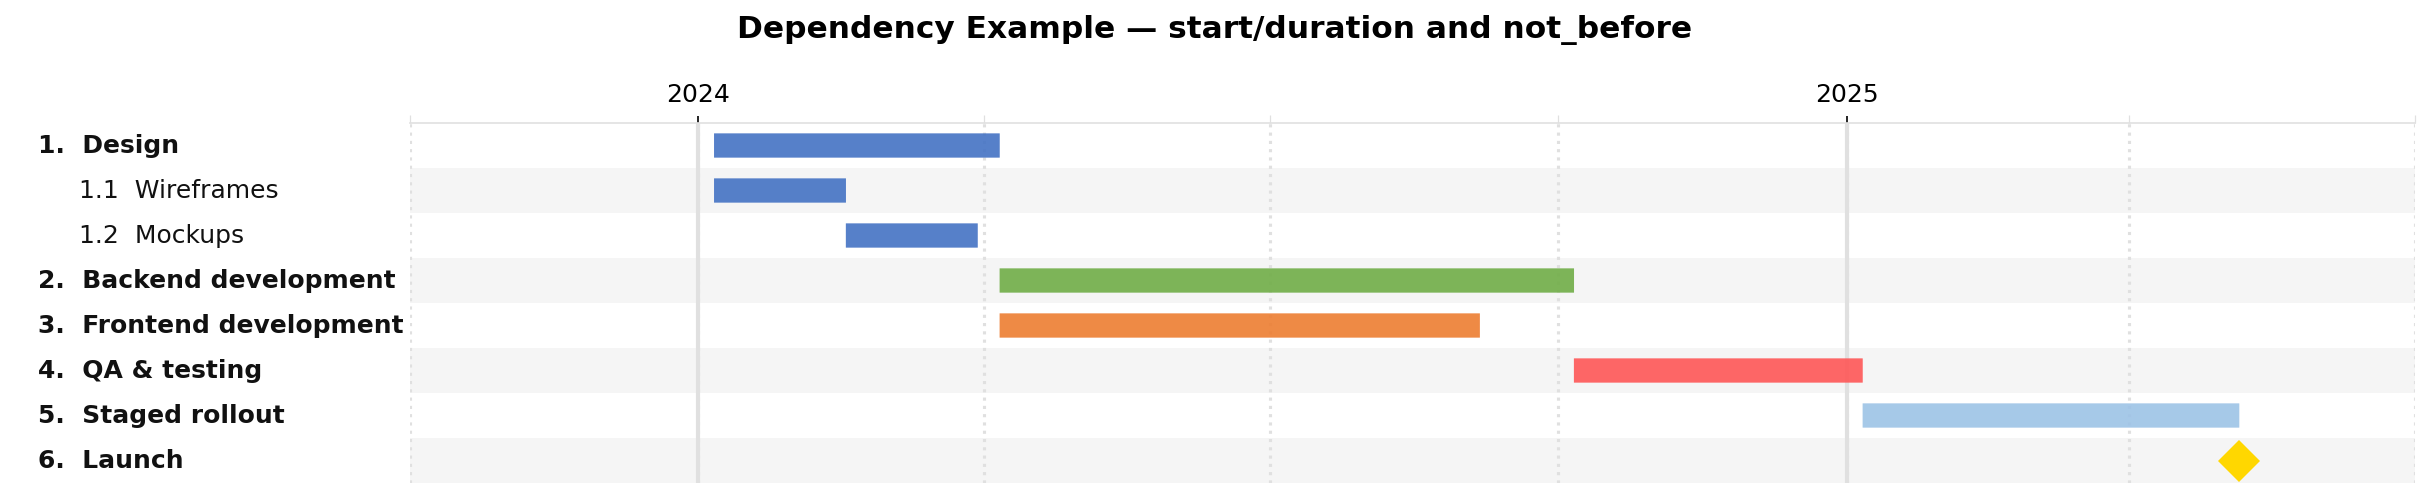
dependencies.json — chained scheduling with not_before
What it shows: an entire schedule built from a single hard start date and duration chains — no end dates written by hand.
Key fields used
Field |
Role in this example |
|---|---|
|
Unique identifier for each task so others can reference it |
|
Only the first task needs a hard start date |
|
All tasks use durations ( |
|
Links a task’s start to another task’s effective end — cascades automatically |
|
|
|
|
JSON
{
  "title": "Dependency Example — start/duration and not_before",
  "dateformat": "%Y-%m-%d",
  "style": {
    "width": 16,
    "major_tick": "year",
    "minor_tick": "quarter"
  },
  "tasks": [
    {
      "id": "design",   "name": "Design",
      "start": "2024-01-06", "duration": "3m", "color": "#4472C4",
      "children": [
        { "id": "wireframes", "name": "Wireframes",
          "start": "2024-01-06", "duration": "6w" },
        { "id": "mockups",    "name": "Mockups",
          "not_before": "wireframes", "duration": "6w" }
      ]
    },
    { "id": "backend",  "name": "Backend development",
      "not_before": "design",  "duration": "6m", "color": "#70AD47" },
    { "id": "frontend", "name": "Frontend development",
      "not_before": "design",  "duration": "5m", "color": "#ED7D31" },
    { "id": "qa",       "name": "QA & testing",
      "not_before": "backend", "duration": "3m", "color": "#FF5757" },
    { "id": "rollout",  "name": "Staged rollout",
      "not_before": "qa",      "duration": "4m", "color": "#9DC3E6" }
  ]
}
Output
Recipes
Add a vertical “today” line
jsonantt project.json chart.png --date-line today
Render at higher resolution for print
jsonantt project.json chart.pdf --dpi 300
Show only the top two nesting levels
jsonantt project.json chart.png --renderdepth 2
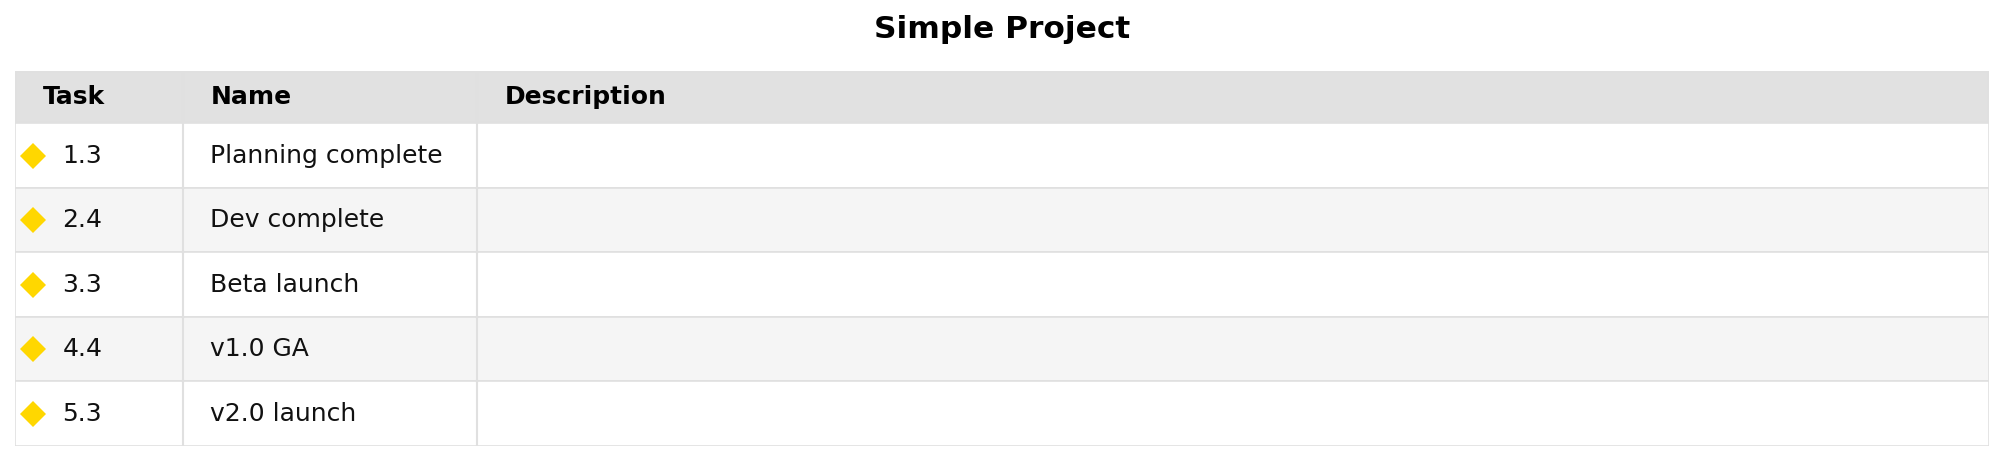
Generate a milestone-only status summary
jsonantt -t project.json milestones.png --milestones-only
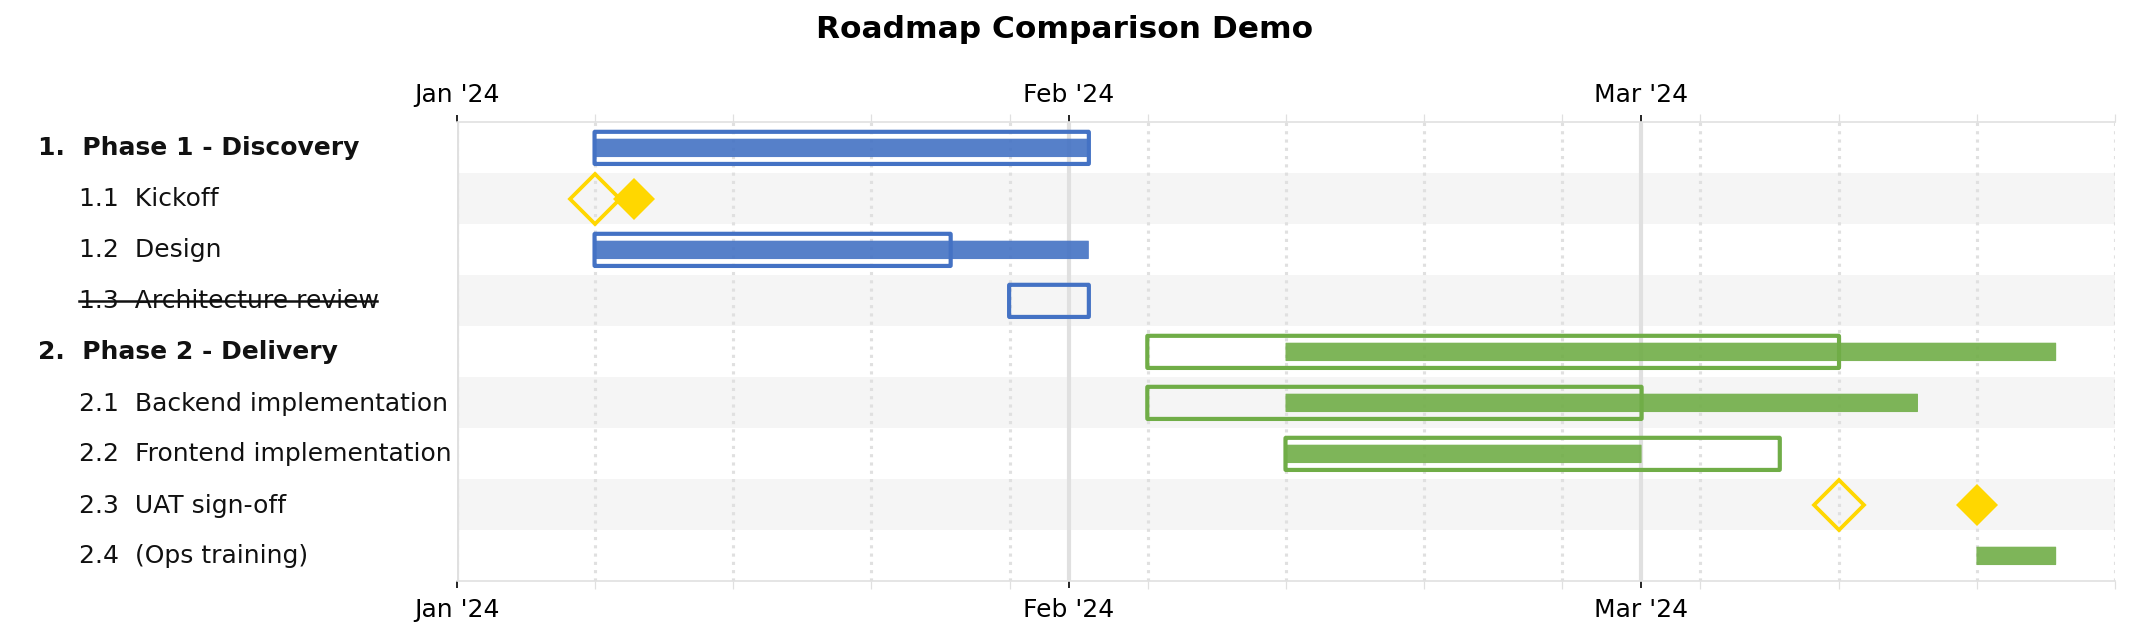
Compare a baseline with an updated schedule
jsonantt planned.json compare.png --compare actual.json
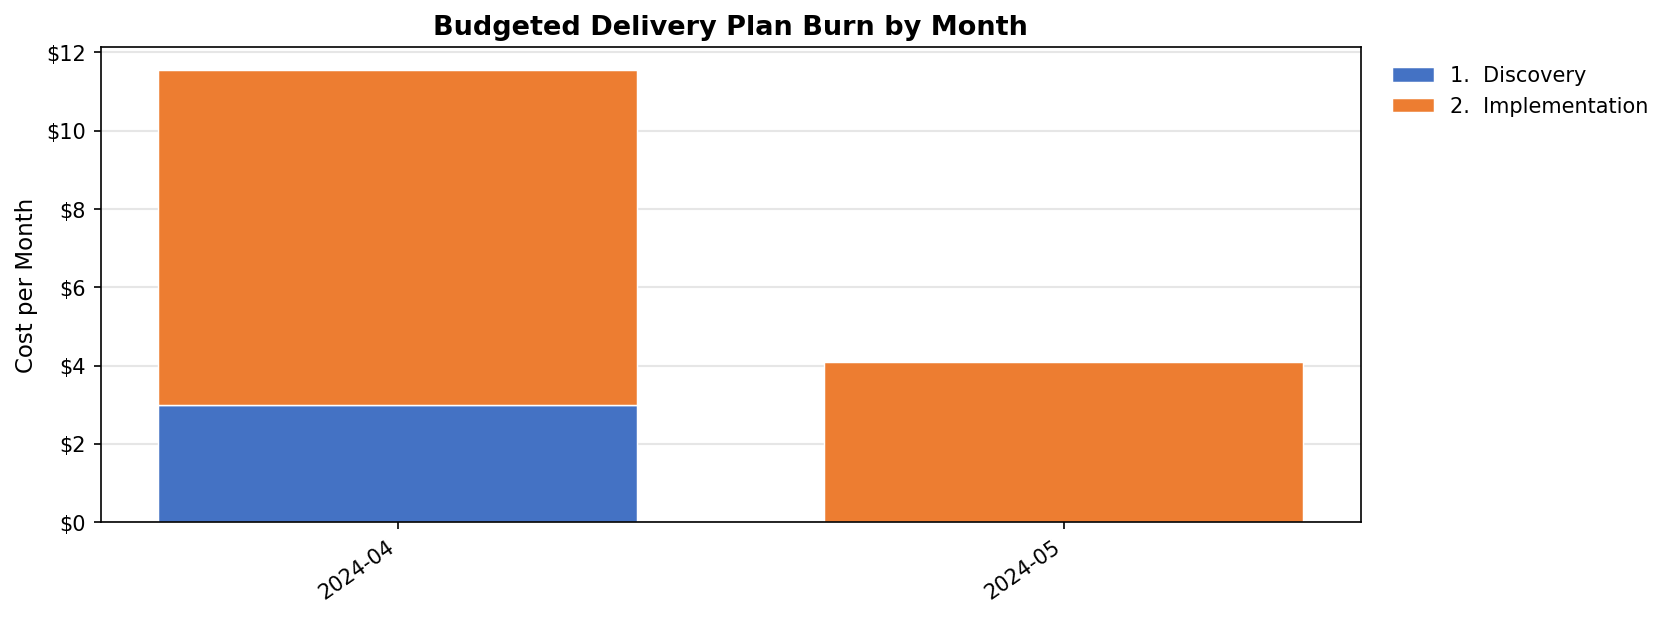
Generate a monthly cost burn chart
Add a "cost" field to each task (e.g. "cost": 50000), then:
jsonantt project.json burn.png \
  --burn --burn-field cost --burn-period month --burn-group 0